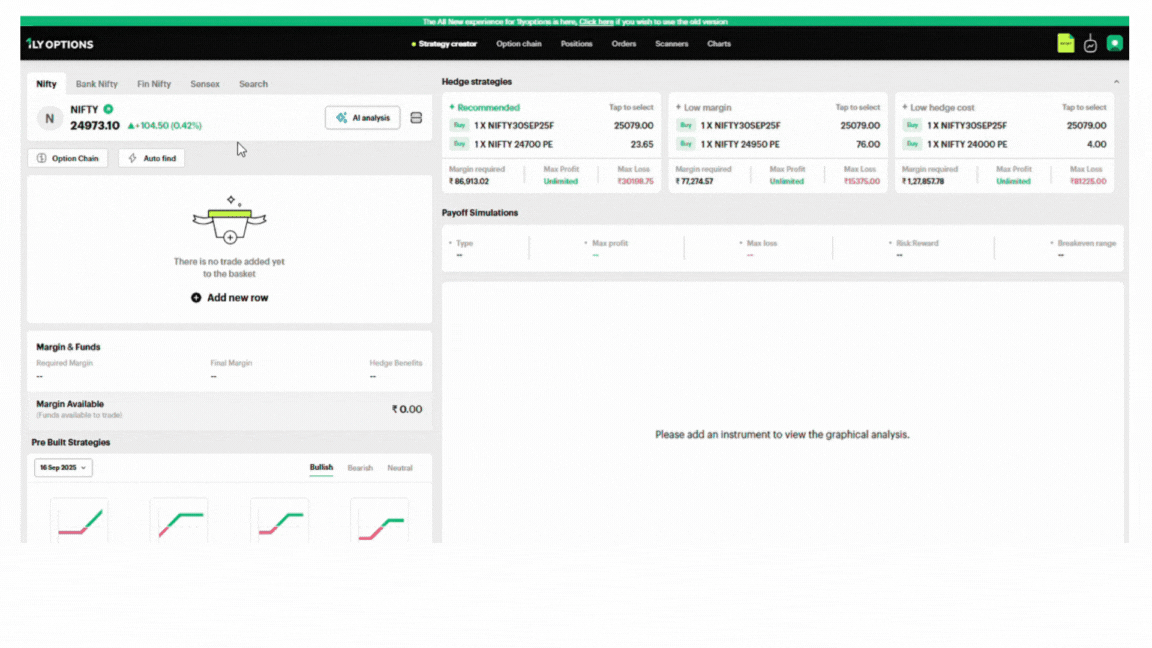
Strategy Creator
The Strategy Creator is a powerful tool that allows traders to design, test, and execute custom options trading strategies in one place. It combines real-time market data, margin requirements, payoff charts, and pre-built strategies into a single interface.
A) Top Bar – User Guide
The Top Bar allows you to navigate between key market indices, search for instruments, access advanced analysis & quickly scan the script.
Market Tabs
- Nifty, Bank Nifty, Fin Nifty, Sensex
- Click on any tab to instantly switch the view to that index.
- The selected market tab (e.g., Nifty) is highlighted in black for easy identification.
Search
- Located on the right side of the index tabs.
- Use this to search for specific stocks, indices, or instruments.
Market Card (Selected Index)
- Displays the current index value (e.g., NIFTY at 24,973.10).
- Shows price change and percentage change in real-time (e.g., +104.50 / +0.42%).
- Upward moves are highlighted in green and downward moves in red.
AI Analysis Button
- Located on the right side of the market card.
- Clicking this opens the AI-powered insights (Trader’s Lens) for the selected index.
- Provides trend, support/resistance, sentiment, and actionable view, Overview of the script.
Scanner
The Scanner is a powerful tool that provides an in-depth view of the selected script/index.
It combines technical indicators, candlestick patterns, pivot levels, and heatmaps into one dashboard for traders.
How to Use the Top Bar
1. Switch Index: Click between Nifty, Bank Nifty, Fin Nifty, or Sensex.
2. Check Live Data: Refer to the market card for real-time index updates.
3. Run AI Analysis: Tap the AI Analysis button to view trader-friendly insights.
4. Search Quickly: Use the search option to find stocks or indices.
5. Scanner: Redirects and opens for the selected script (e.g., Nifty 50), providing in-depth details.
B) Order Placement Module
The order placement module allows you to build option strategies by adding trades manually or through quick tools like Option Chain and Auto Find.
1. Add New Row
- Click “Add new row” to manually add a trade to your basket.
- Each row represents a trade leg (Buy/Sell Call or Put).
- You can configure:
- Expiry Date
- Strike Price
- Option Type (CE/PE)
- Lots
- Order Type (MKT/LMT)
Net premium and charges are calculated automatically.
2. Option Chain
- Clicking the Option Chain opens a table with Calls & Puts.
- Displays:
- Open Interest (OI)
- Change in OI %
- LTP (Last Traded Price)
- IV (Implied Volatility)
- Volume
- Traders can select a strike directly from this table to add into the strategy basket.
3. Auto Find
- Clicking Auto Find lets the system automatically pick strikes based on delta or lots.
- You can configure:
- Buy/Sell
- Option Type (CE/PE)
- Lots
- Delta filter (e.g., find options with delta 15).
- Once set, click Screen and the tool auto-selects relevant options for you.
4. Trade Basket & Execution
- All selected trades appear in the basket section.
- The basket shows Net Premium, Charges, and Margin Requirement.
- Click Execute to place the multi-leg order directly.
C) Margin & Funds
The Margin & Funds panel shows the capital required and available to execute your selected strategy. It helps traders plan positions effectively by understanding margin impact.
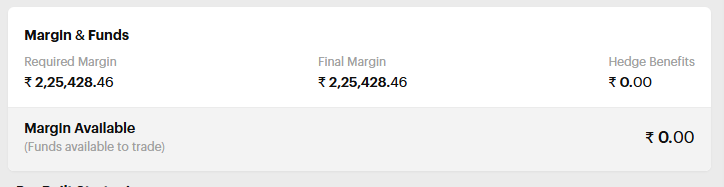 Required Margin
- The margin amount needed to take the selected trade(s).
- Calculated dynamically based on strike, lots, and type of position.
Final Margin
- The effective margin is blocked after including any adjustments.
- Usually same as required margin unless hedge or margin benefits are applied.
Hedge Benefits
- Displays reduction in margin due to hedged strategies (e.g., spreads, iron condor).
Margin Available
- Shows the amount of free margin (funds) available in your account to place trades.
D) Pre-Built Strategies
The Pre-Built Strategies section allows traders to quickly select from ready-made options strategies without manually adding trades. These are categorized into Bullish, Bearish, and Neutral outlooks.
How It Works
1. Select the expiry date from the dropdown.
2. Choose a market view → Bullish, Bearish, or Neutral.
3. Click on a strategy card to instantly load it into the strategy basket.
4. The system auto-fills strikes, lots, and option types for that strategy.
Categories & Strategies
Bullish Strategies
- Buy Call
- Sell Put
- Bull Call Spread
- Bull Put Spread
- Bull Butterfly
- Bull Condor
- Long Calendar with Calls
- Call Ratio Back Spread
Bearish Strategies
- Buy Put
- Sell Call
- Bear Put Spread
- Bear Call Spread
- Bear Butterfly
- Bear Condor
- Long Calendar with Puts
- Put Ratio Back Spread
Neutral Strategies
- Short Straddle
- Short Strangle
- Iron Butterfly
- Iron Condor
- Batman
- Double Plateau
- Jade Lizard
- Reverse Jade Lizard
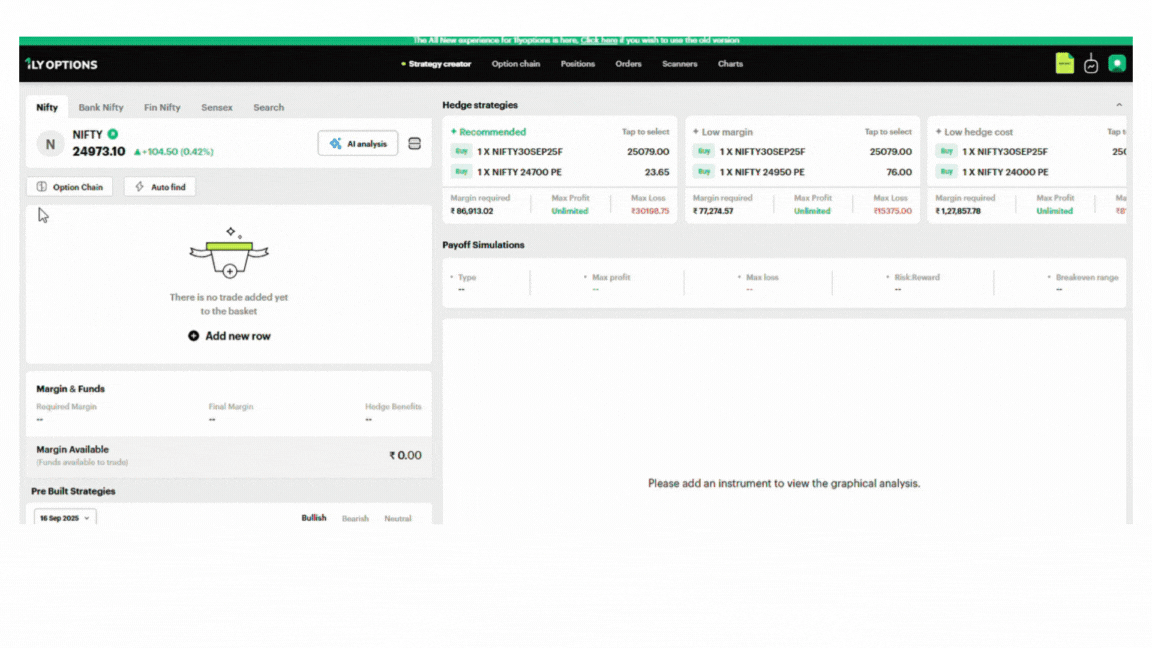
E) Hedge Strategies
The Hedge Strategies panel provides ready-made strategies. As soon as you click on any hedge strategy card, it is auto-loaded into the order module for quick execution.
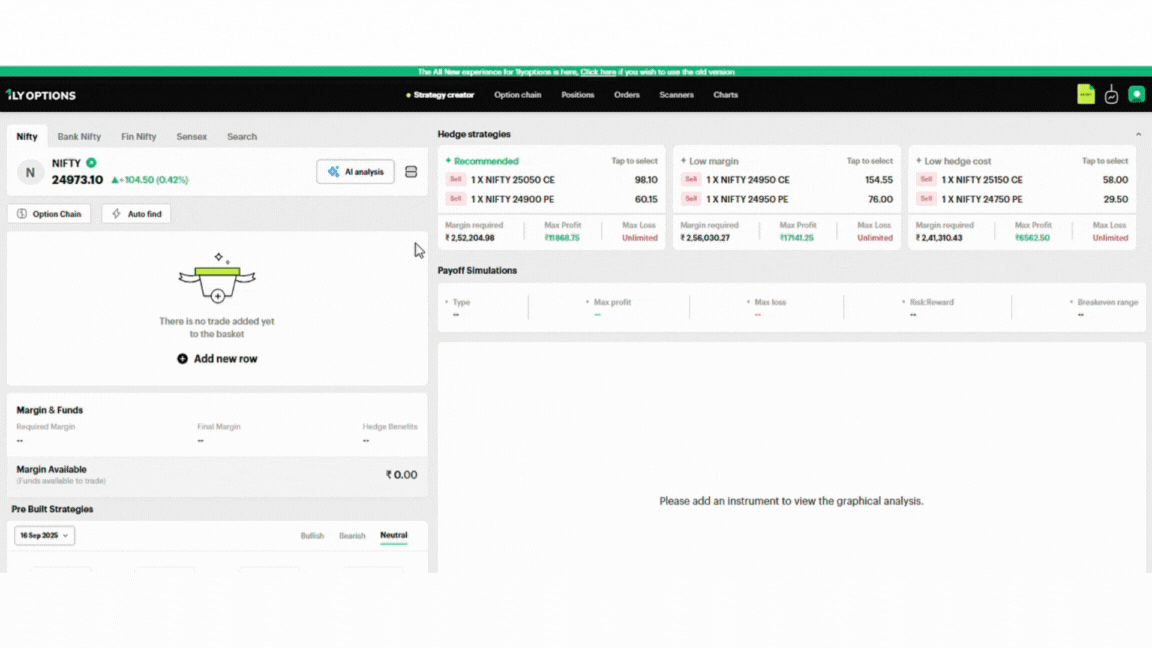
Select Hedge Strategy
Click on one of the cards under Hedge Strategies:
- Recommended
- Low Margin
- Low Hedge Cost
Auto Strategy Creation
- The system automatically adds the selected legs (CE/PE with strikes and expiries) into the order basket.
- All details such as net premium, charges, margin required, and hedge benefits are updated instantly.
Order Module Reflection
The hedge legs now appear in the Order Module (trade basket).
You can review:
- Strategy Type (Neutral/Bullish/Bearish)
- Max Profit / Max Loss
- Breakeven range
- Risk:Reward ratio
Execution in One Click
- After reviewing, simply click Execute to place the multi-leg hedge order.
- No need to manually select strikes or build strategies — it’s all automated.
Benefits for Traders
- Fast Execution: Avoids manual strike selection.
- Error-Free: Legs are pre-configured with correct strikes and expiries.
- Capital Efficient: Shows margin and hedge benefits before order placement.
- One-Click Trading: Streamlines hedge setup and execution.
F) Payoff Simulations
The Payoff Simulations panel allows traders to visualize the profit & loss outcomes of their selected strategy before execution. It provides clarity on risk, reward, breakeven levels, and payoff structure.
Strategy Type
- Displays whether the current setup is Bullish, Bearish, or Neutral based on legs added.
Max Profit
- The highest possible profit from the strategy.
- Example: ₹11,868.75.
Max Loss
- The maximum potential loss.
- Some strategies may show Unlimited loss (e.g., naked options).
Risk:Reward Ratio
- Compares potential risk vs reward. Helps traders evaluate strategy efficiency.
Breakeven Range
- Price range where no profit or loss occurs.
- Example: 24750 (-0.89%) < Spot < 25250 (+1.11%).
Why It’s Useful
- Gives a clear picture of potential outcomes before trade execution.
- Helps traders manage risk exposure by knowing max loss upfront.
- Supports strategy comparison (different strikes/margins vs payoff).
- Ensures confidence in executing multi-leg strategies.
Post Adding a Script (Detailed State)
Once a strategy is added to the basket, the payoff simulation activates and displays:
A. Payoff Graph (Visual Analysis)
- X-axis → Underlying price levels.
- Y-axis → Profit/Loss values.
- Green Area: Profit zone.
- Red Area: Loss zone.
- Spot Marker: Current index/stock price.
- Breakeven Points: Highlighted on chart.
- Standard Deviation Bands (+1SD, +2SD, -1SD, -2SD): Market movement probability zones.
- Option to overlay Open Interest (OI) bars for deeper analysis.
B. P&L Table
- Tabular view of estimated profit/loss at different price levels.
- Helps traders see exact values instead of just the chart.
C. Greeks
- Shows option greeks like Delta, Theta, Gamma, Vega for advanced risk analysis.
- Useful for active options traders managing sensitivity.
D. Standard Deviation Control
- A slider (– / +) lets you adjust the Standard Deviation levels displayed on the chart.
- Helps test strategy payoff against different volatility scenarios.
G) Targets & Strikewise IV’s
This section allows traders to customize their strategy simulations by setting expected targets, expiry dates, and implied volatility (IV) adjustments.
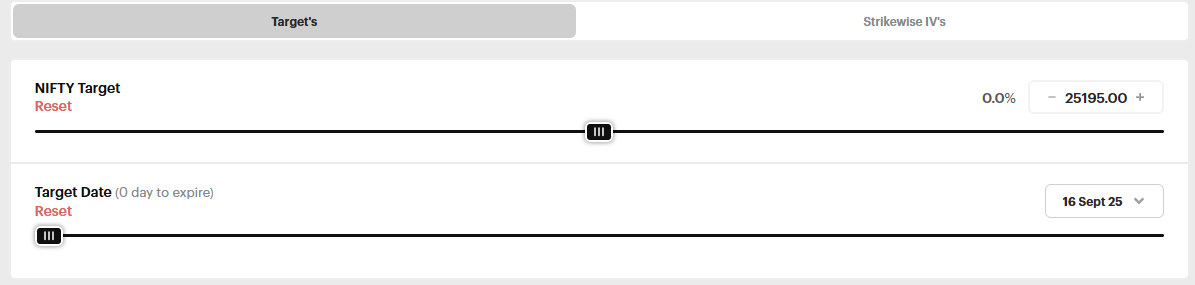
1. Script Target
- What it does: Lets you set your price target for NIFTY within the chosen expiry.
- How to use: Move the slider to adjust % move (up/down). Value updates automatically (e.g., +1.0% → 25,223.35).
- Why useful: Helps simulate strategy P&L if market hits your expected target.
2. Script Target Date
- What it does: Lets you set a date before expiry to simulate P&L.
- How to use: Adjust slider to pick a target day (e.g., 2 days to expiry → 14 Sep 2025).
- Why useful: Shows time decay (Theta impact) on your strategy before expiry.
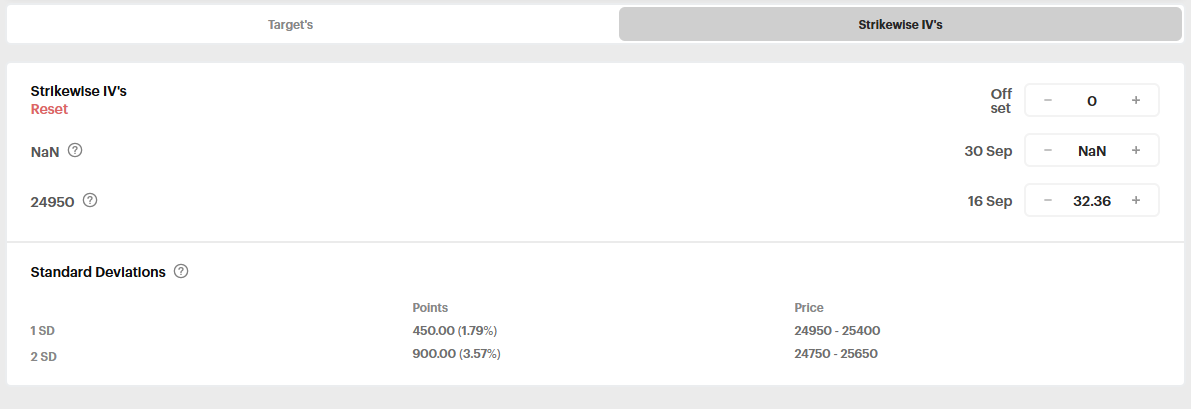
3. Strikewise IV’s
- What it does: Allows you to adjust Implied Volatility (IV) for individual strikes.
- How to use: Use the + / – buttons to increase/decrease IV %.
Example: Strike 25050 → IV 11.7%, Strike 24900 → IV 10.13%.
- Why useful: Helps test “what if volatility changes” scenarios, especially during events (Budget, Fed meeting, Results).
4. Standard Deviations (SD)
- What it shows: Probable price ranges based on volatility.
- 1 SD: 68% probability → (e.g., 24,700 – 25,250).
- 2 SD: 95% probability → (e.g., 24,450 – 25,500).
Why It’s Useful for Traders
- Scenario Testing: Check how strategies behave with different price moves, time left, and volatility changes.
- Volatility Sensitivity: See how IV rise/fall impacts options pricing.
- Probability View: Standard deviation ranges give realistic expectation of market moves.
- Better Risk Planning: Combines price, time, and volatility dimensions for strategy evaluation.