Charts Tab
The Charts tab in 1LYOptions is a powerful tool that combines charting with an integrated option chain view. This allows traders to analyze price movements visually while simultaneously monitoring option data—helping in faster and more accurate trading decisions.
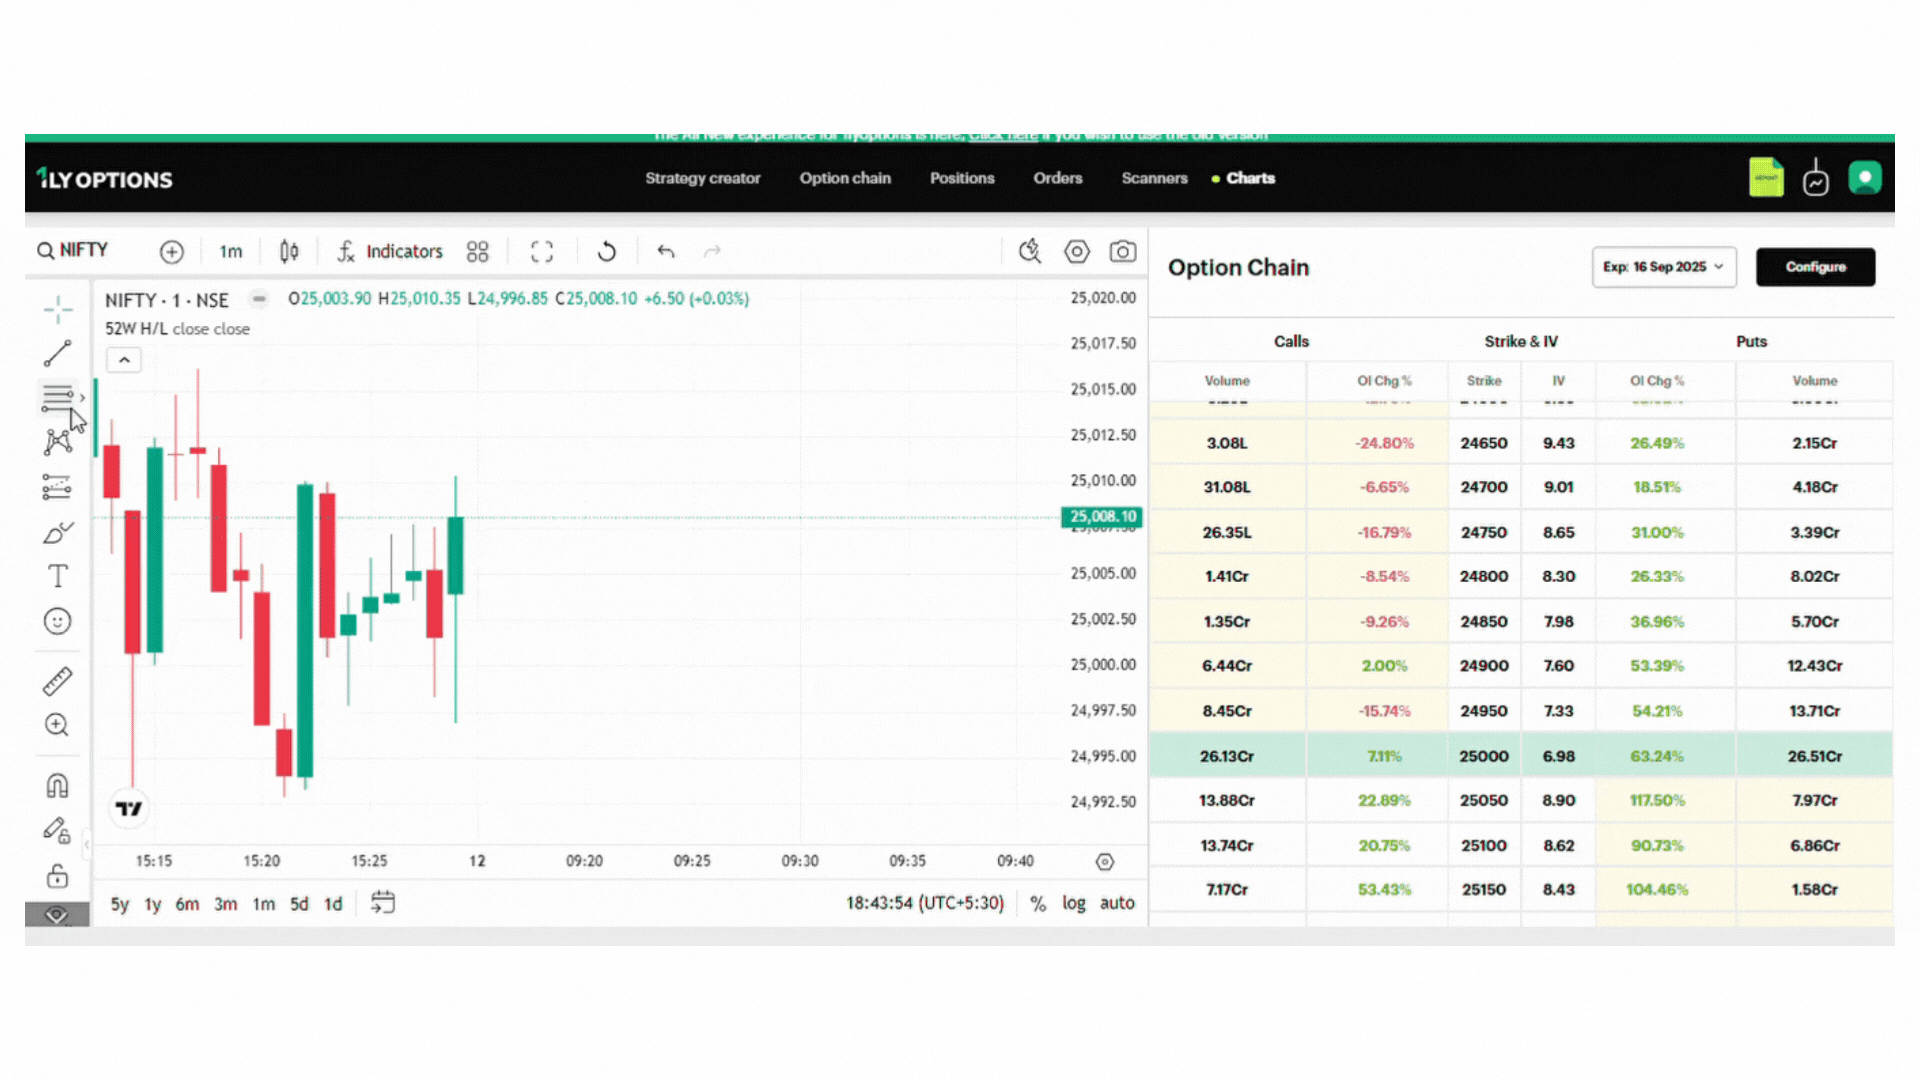
1. Accessing the Charts Tab
- Navigate to the top menu and click Charts.
- The screen splits into two sections:
- Left: Interactive candlestick chart.
- Right: Option Chain for the selected instrument.
2. Working with Charts (Left Panel)
A. Symbol Selection
- Click the symbol dropdown/search to switch between indices and stocks.
- Example: Search for TATAELXSI, MIDCPNIFTY, DMART or any NSE stock/index.
B. Timeframes
- Select candle intervals: 1m, 5m, 15m, 30m, 1h, 1d, 1w, 1M.
- Use short-term (1m–15m) for intraday trades, higher (1d–1w) for positional setups.
C. Indicators & Tools
- Indicators Menu: Add SMA, EMA, VWAP, RSI, Bollinger Bands, Supertrend, etc.
- Drawing Toolbar (Left side):
- Trendlines
- Fibonacci retracement
- Horizontal/Vertical lines
- Text annotations
- Shapes & patterns
- Chart Types: Switch between candlesticks, line, bar, or area charts.
D. Price Data
- Hover over any candle to see OHLC values:
- O = Open
- H = High
- L = Low
- C = Close
Example: Candle at 14:55 → O: 25,003.90, H: 25,010.35, L: 24,996.85, C: 25,008.10.
3. Option Chain Integration (Right Panel)
The integrated Option Chain updates in real time alongside charts, allowing you to track derivatives data.
A. Key Columns
- Strike Price (center column)
- Calls (left side): LTP, OI, OI Change %, Volume
- Puts (right side): LTP, OI, OI Change %, Volume
- IV (Implied Volatility): For both Calls & Puts
B. Expiry Selection
- Dropdown at the top lets you choose expiry dates (e.g., 16 Sep 2025, 23 Sep 2025).
C. Configuration (Settings)
- Display: Toggle Calls/Puts visibility.
- Show/Hide Columns: Add Greeks (Delta, Theta, Gamma, Vega).
- No. of Strikes: Adjust how many strikes to display (2–84).
4. Placing Orders from Charts
You can place trades directly from the Option Chain panel on the right:
- Click Buy or Sell beside a strike.
- An Order Window opens:
- BUY / SELL toggle
- Intraday (MIS) or Normal (NRML)
- Order Type: Market / Limit / SL
- Lots / Quantity
- Price & Trigger Price
- Margin Required, Charges, and Available Margin
- Click Execute to place the order.
Example:
- NIFTY 16th SEP 23,700 CE @ ₹1,315.
- Margin Required = ₹1,04,870.78.
- Charges = ₹67.44.
5. Example Workflow
- Open Charts tab and select NIFTY.
- Choose 1m timeframe for intraday view.
- Apply EMA (20) and VWAP from indicators.
- Monitor price action (candles forming breakout at 25,000).
- On the right, confirm with Option Chain:
- CE OI decreasing, PE OI increasing = bearish trend confirmation.
- Click Sell PE 25,000 directly from the option chain.
- Place order with correct margin and lot size.